How to use the indicator EMA (Exponential Moving Average) in trading
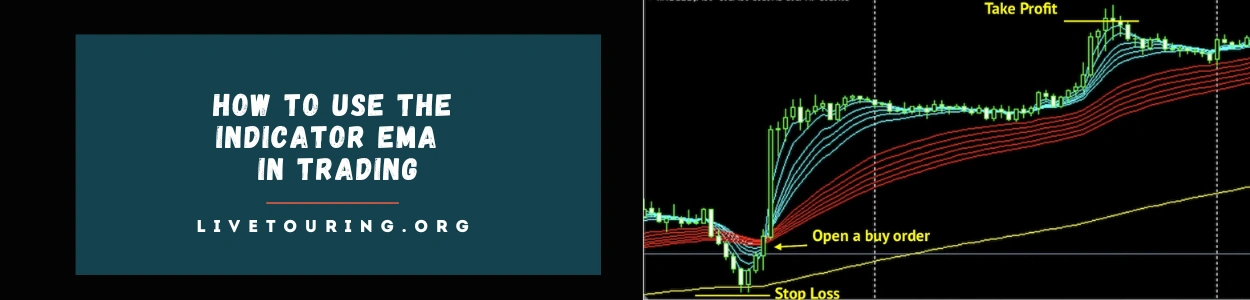
If you’re trading or investing, the Exponential Moving Average (EMA) is one of the most powerful tools you can add to your charting toolbox. In this guide, we break down exactly what indicator EMA is, why traders love it, and how to use it across different markets — from forex to stocks and cryptocurrencies.
Quick navigation
What is EMA indicator?
The EMA is a type of moving average (MA) — a technical-analysis line that smooths out price data over a certain period. Unlike a Simple Moving Average (SMA), which treats all past data equally, EMA gives more importance to recent prices, so it reacts faster to new market moves.
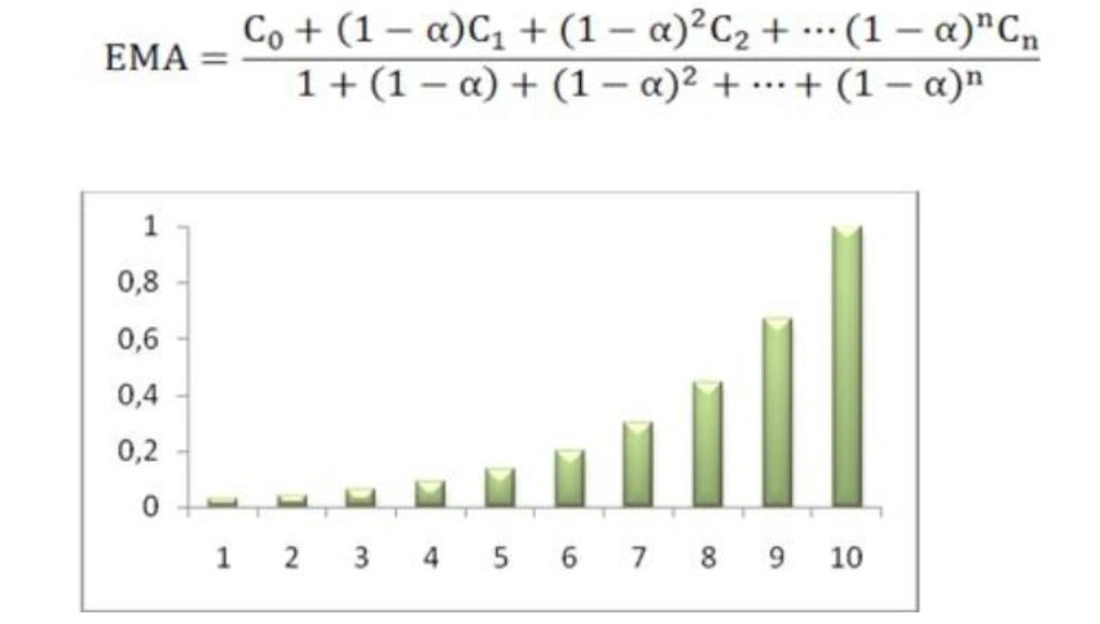
EMA Formula
The Exponential Moving Average (EMA) is calculated by applying more weight to recent prices, which makes it react faster to market changes compared to a Simple Moving Average (SMA). Most moving averages — including EMA — are based on closing prices, because they reflect the final market sentiment for each period.
The EMA formula looks like this:
EMA = (Closing Price × Multiplier) + (Previous EMA × (1 − Multiplier))
Where the Multiplier is: Multiplier = 2 / (EMA Period + 1)
This calculation helps the EMA line smooth out market noise while still staying sensitive to price movements. Because of this, traders often choose different EMA settings (such as 9, 20, 50, 100, or 200 EMA) depending on their strategy — whether they need a fast trend signal or a long-term market direction.
Understanding the EMA formula is essential for anyone using EMA trading strategies, EMA crossover strategies, or identifying dynamic support and resistance. It also explains why the EMA is considered a lagging indicator, yet more responsive than SMA, making it one of the most popular tools in forex, crypto, and stock trading.
How to Add EMA to Your Chart (e.g. MT4)
If you use a trading terminal such as MetaTrader 4 (MT4):
1. Open the chart of the asset you wish to analyze. Go to Insert → Indicators → Trend → Moving Average.
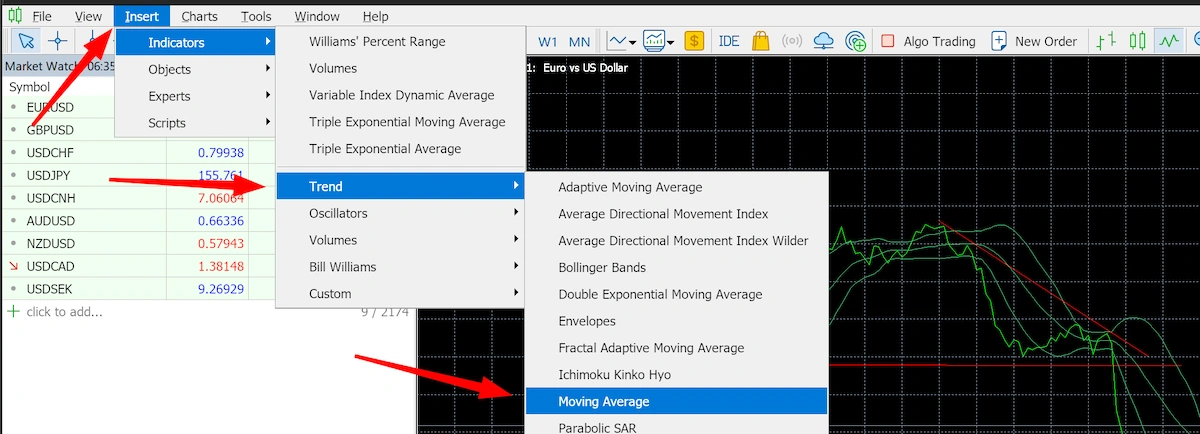
2. In the settings window:
- Change the method to “Exponential” (instead of Simple).
- Choose the period (common ones: 20, 50, 100, 200 — depending on your timeframe and strategy).
- Optionally pick a color to make the line easy to distinguish.
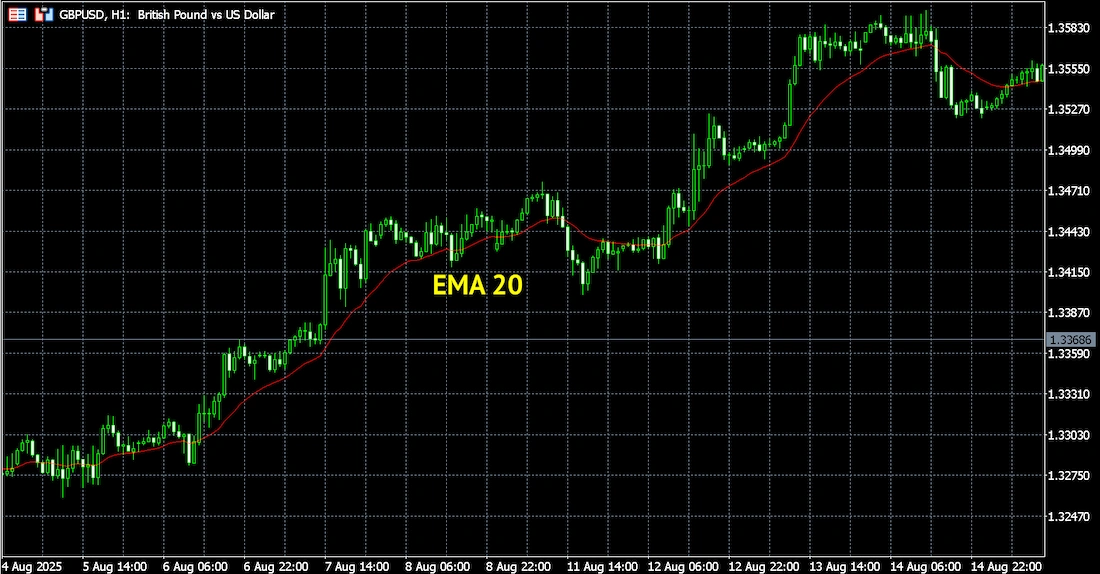
3. Confirm — the EMA line will appear on your chart, ready to use.
Best EMA Settings for Beginners
The table below shows the best EMA settings for beginners. These EMA periods help traders see the trend, reduce market noise, and understand when the price is moving up or down. They also make it easier to find support and resistance levels and spot changes in market momentum. With these simple settings, beginners can choose the right EMA for day trading, swing trading, or long-term analysis.
| EMA Period | Name / Type | Best Use Case | Why It’s Useful |
|---|---|---|---|
| 9 EMA | Fast EMA | Scalping & intraday trading | Reacts quickly to price changes; good for early signals |
| 12 EMA | Fast EMA | Short-term momentum | Helps spot short-term trend shifts |
| 20 EMA | Medium EMA | Swing trading & trend confirmation | Shows medium-term direction; great for pullback entries |
| 50 EMA | Medium/Long EMA | Identifying main trend direction | Filters noise; used for trend trading |
| 100 EMA | Long EMA | Long-term market bias | Helps avoid false signals in volatile markets |
| 200 EMA | Major Trend EMA | Key support/resistance & market structure | One of the most popular indicators among traders; shows overall trend |
How to Use the EMA Indicator in Daily Trading
1. Identifying the Trend.
One of the most common mistakes traders make is trading against the trend. The EMA indicator is a reliable tool for identifying market trends and helping you trade in the right direction. There are two simple ways to avoid losing trades:
- Watch the slope of the EMA line on the chart. A steep EMA slope is a strong signal that you should avoid trading against the current market momentum. The steeper the angle, the stronger the trend.
In the chart example below, you can see a sharp upward move, which shows a powerful bullish trend. Trading against it would increase the risk of false signals and bad entries.
- Monitor how far the price moves away from the EMA. The greater the distance between the price and the EMA line, the stronger the market trend. This helps traders understand the strength of the price momentum and avoid entering the market against a powerful move.
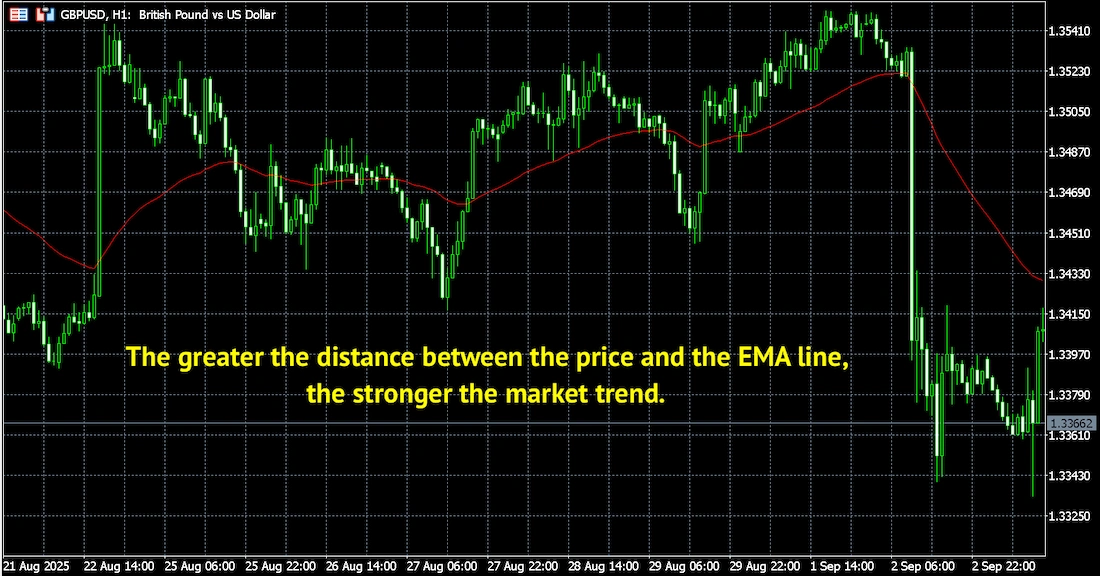
By understanding the strength of the trend with the EMA, you can protect yourself from unnecessary losses. Always pay attention to the distance between the EMA line and the price — it helps you see how strong the market momentum really is.
2. The 200 EMA Indicates Support and Resistance Levels.
For example, on the M30 chart of Intel stock with a 200-period EMA, the price may repeatedly approach and touch the EMA 200 line but then bounce off it. This EMA line can act as dynamic support or resistance.
By observing this behavior, traders can plan bounce trades and potentially make profits during the day. Using the 200 EMA in this way helps confirm the trend direction and provides a reliable price action reference for intraday trading.
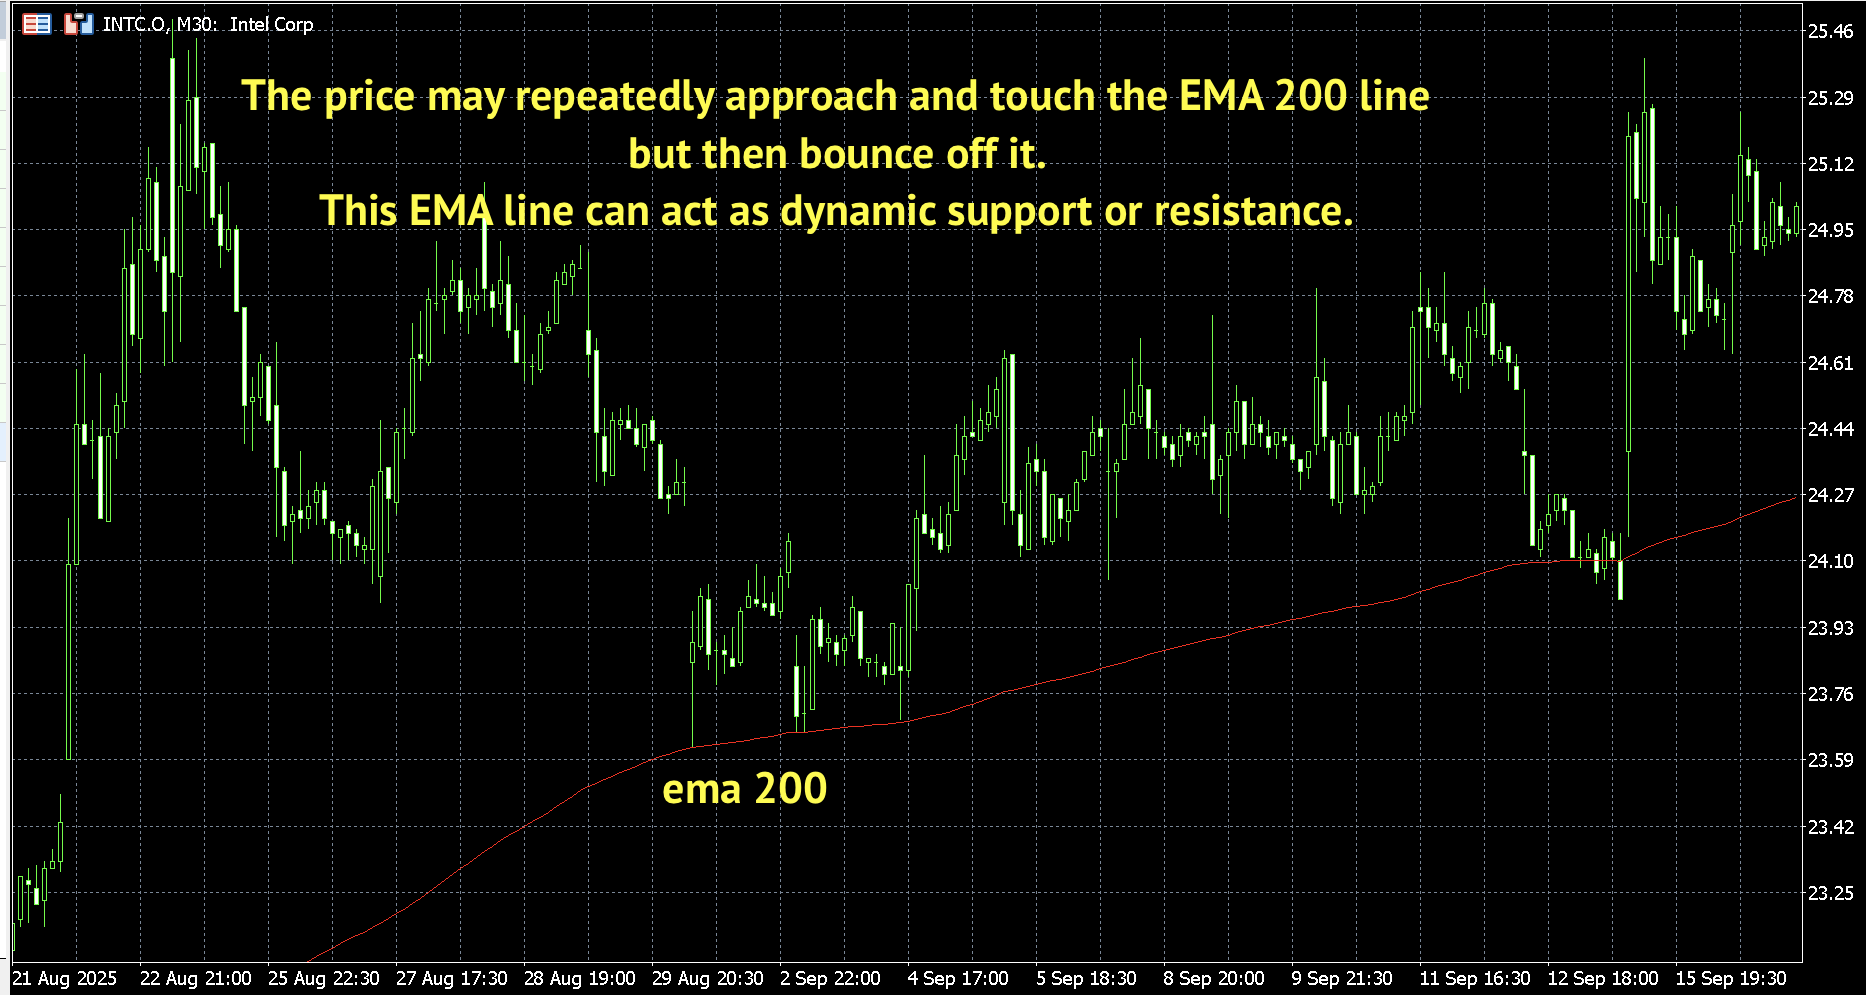
In the Intel stock example, the profits were as follows:
- 51 points in the first trade,
- 93 points in the second,
- 112 points in the third.
This shows how using the EMA for trend confirmation and dynamic support/resistance can help traders capture intraday price momentum effectively.
EMA Strategies
The EMA is a great tool to recognize prevailing trends across any timeframe. In this strategy, traders use:
- Short-term EMAs with periods of 3, 5, 8, 10, 12, and 15,
- Medium-term EMAs with periods of 30, 35, 40, 45, 50, and 55,
- Long-term trend EMA — the 200 EMA.
Together, these create 13 moving averages on the chart. Having this many EMAs helps confirm that the price is moving in the direction of the trend you expect. Don’t worry about reading the lines — it’s actually very easy to identify trend direction, observe price momentum, and make informed trading decisions.
On the XAUUSD chart with the marked trading level:
- The 3, 5, 8, 10, 12, and 15-period EMAs are shown in blue;
- The 30, 35, 40, 45, 50, and 55-period EMAs are shown in red;
- The 200 EMA is shown in yellow.
This color coding helps traders quickly identify short-term and long-term trends, observe market momentum, and use EMAs as dynamic support and resistance levels.
On the M30 timeframe for the Gold/USD pair, the 200 EMA indicates an upward trend, so we only take Buy signals. This ensures trading in the direction of the trend and aligns with market momentum.
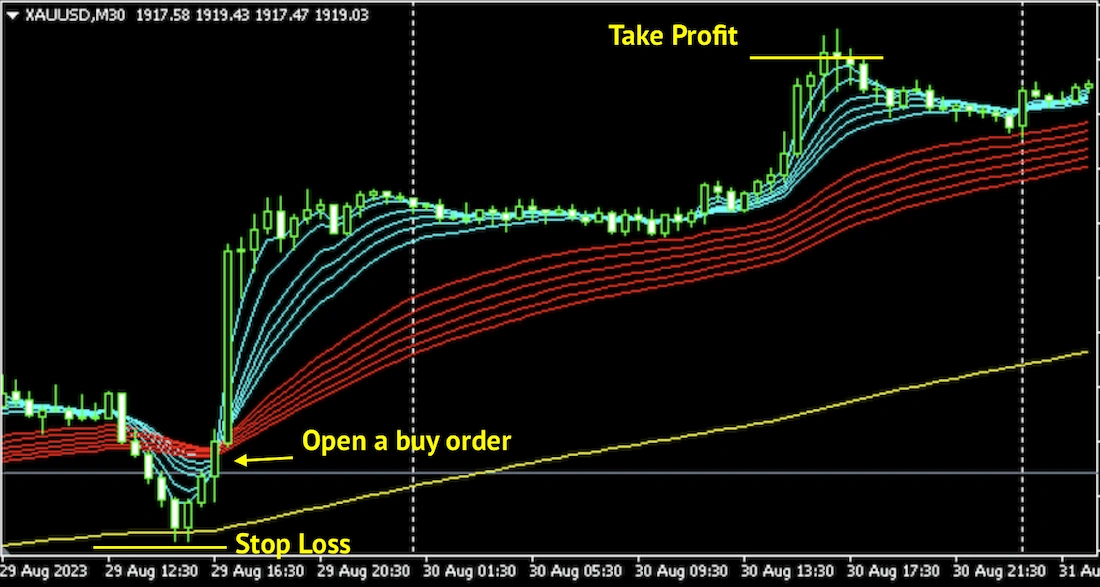
We open a long position (Buy) when the group of short-term EMAs (marked in blue on the chart) crosses upward through the long-term EMAs (marked in red) from below. However, it’s important to trade in the direction of the trend. Therefore, an additional condition is that the 200 EMA must indicate a rising trend.
We open a short position (Sell) when the group of short-term EMAs (blue) crosses down through the falling EMAs (red) from above. The additional condition is that the 200 EMA should indicate a downward trend.
We take profits in the following ways:
- When the short-term EMA group crosses the long-term EMA group again. However, this exit method is not always reliable.
- Near a support or resistance level indicated.
- When the RSI indicator shows overbought or oversold conditions.
These methods help traders close positions while respecting trend strength, market momentum, and dynamic support and resistance levels.
We place the stop-loss just beyond the support or resistance level, taking into account risk management and proper money management.
Capital Management
Capital management is a crucial part of any trading strategy. Even the best EMA trading strategy won’t generate consistent profits if a trader chooses a position size that is too large or too small. This is especially important for scalping strategies, which carry higher investment risk.
Professional traders may execute hundreds of trades per day. They cannot take excessive risk on a single trade, because their goal is to profit from small price movements. A too wide stop-loss or too large position size can wipe out gains from multiple profitable trades.
For scalping trades, regardless of the market or instrument, it is recommended to risk no more than 0.5% of account capital per trade.
Accordingly, the Stop Loss in this strategy should be set at 0.5% of capital, with the option to move it to breakeven. Take Profit should be calculated based on the risk-to-reward ratio, ideally 1:2, meaning 1% of capital.
Another interesting approach is to combine EMA with other technical indicators to enhance trend confirmation and trade entry signals.
EMA + Laguerre Indicator
This trading strategy is based on two Exponential Moving Averages (EMAs):
- 16-period EMA (short-term),
- 48-period EMA (long-term).
When the 16-period EMA is above the 48-period EMA, buyers dominate the market (bullish trend). Conversely, if the short-term EMA (16) is below the long-term EMA (48), sellers are in control (bearish trend).
To filter out false signals, the Laguerre indicator is used, which identifies overbought and oversold conditions.
Conditions for Entering a Buy Trade:
- The 16-period EMA is above the 48-period EMA (bull market).
- The candle closes above the short-term EMA (16).
- The Laguerre indicator is at 0.8 or higher.
For example, on a 4-hour EURUSD chart, we enter a trade at 1.22154.
- Stop Loss: 10–20 pips below the 16-period EMA.
- Take Profit: based on a risk-to-reward ratio of 1:2 (in the example, Stop Loss is 100 pips → Take Profit is 200 pips).
It is recommended to use a trailing stop or gradually move the Stop Loss to secure profits and maximize gains.
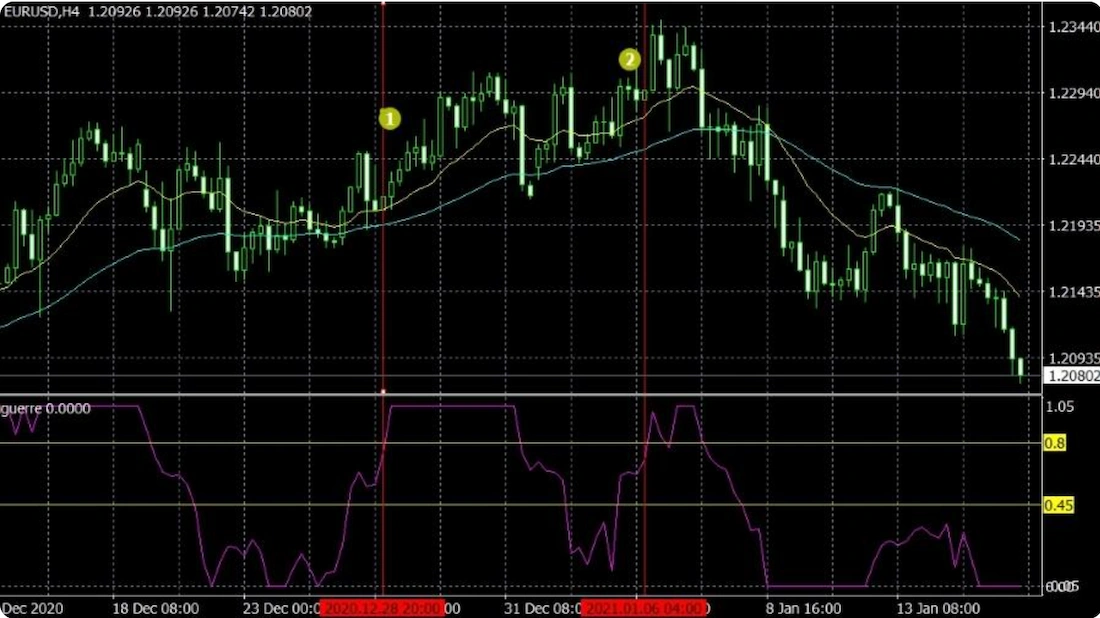
In the first example above, the price moved 924 points, and in the second, 550 points.
Conditions for Entering a Sell Trade:
- The 16-period EMA is below the 48-period EMA (bearish market).
- The next candle closes below the 16-period EMA.
- The Laguerre indicator falls below 0.2.
As you can see, the Exponential Moving Average (EMA) provides flexibility to navigate constantly changing markets. However, like any trading strategy, it requires some adjustments and testing on different currency pairs and timeframes to optimize performance.
EMA Ribbon
The EMA Ribbon is a free, enhanced indicator based on short-term and long-term EMAs, available on TradingView. A bullish trend is shown in green, while a bearish trend is shown in burgundy. Colors can be customized in the settings.
EMA crypto trading strategy. For the LINK/USDT pair on the M15 timeframe, we use the following EMAs: 20 EMA, 25 EMA, 30 EMA, 35 EMA, 40 EMA, 45 EMA, 50 EMA, and 55 EMA.
- A sell trade is opened when all eight EMA lines cross downward.
- The stop loss is placed above the local resistance level.
- The take profit is set at the support level or when all EMAs cross upward again.
According to this trading system, we open a short position with 20x leverage at $13.144. The stop loss is placed at $13.425. Profit is taken at $12.14. The risk-to-reward ratio for this trade is 1:3, and the return with leverage is 152%.
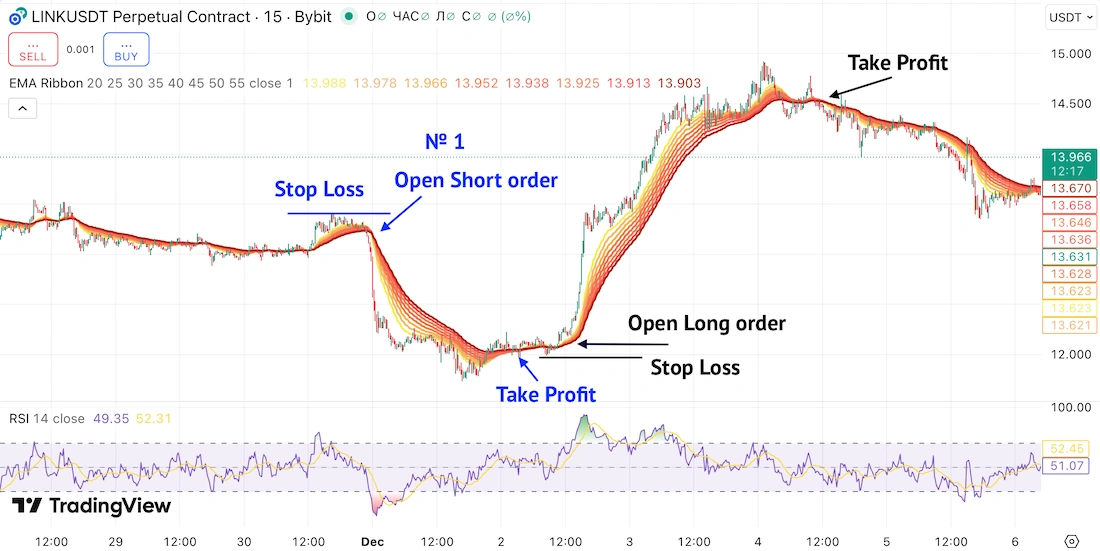
Next, we open a long trade at $12.281 with 20x leverage. The stop loss is placed at $11.96, and profit is taken when the price reaches $14.52. The risk-to-reward ratio for this trade is 1:6, and the leveraged return is 364%.
It is important to remember that trend indicators, including EMAs, generate many false signals during sideways (ranging) markets.
ema cross
The EMA cross algorithm generates signals based on moving-average crossovers. In our example, we use the 20, 50, and 200-period EMAs, but you can choose any other settings depending on your strategy and the asset you trade. For convenience, each crossover is marked with an “X” on the chart.
You open a trade when all three moving averages cross in the direction indicated by the shorter-term EMAs. For example, if the 20-period (red) and 50-period (maroon) EMAs cross the 200-period (blue) EMA from below, you open a Buy order.
For example, let’s look at ETH/USDT on the 15-minute chart using the 20 EMA, 50 EMA, and 200 EMA.
- You open a short trade when all three EMAs cross downward and the price breaks the local support level.
- The stop-loss is placed above the recent local high.
- You take profit when the short-term EMAs (20 and 50) cross back upward.
Using this trading setup, we open a short position with 20x leverage at $4,095.45. The stop-loss is placed above $4,190, and profit is taken when the 20 and 50-EMAs cross at $3,818.80.
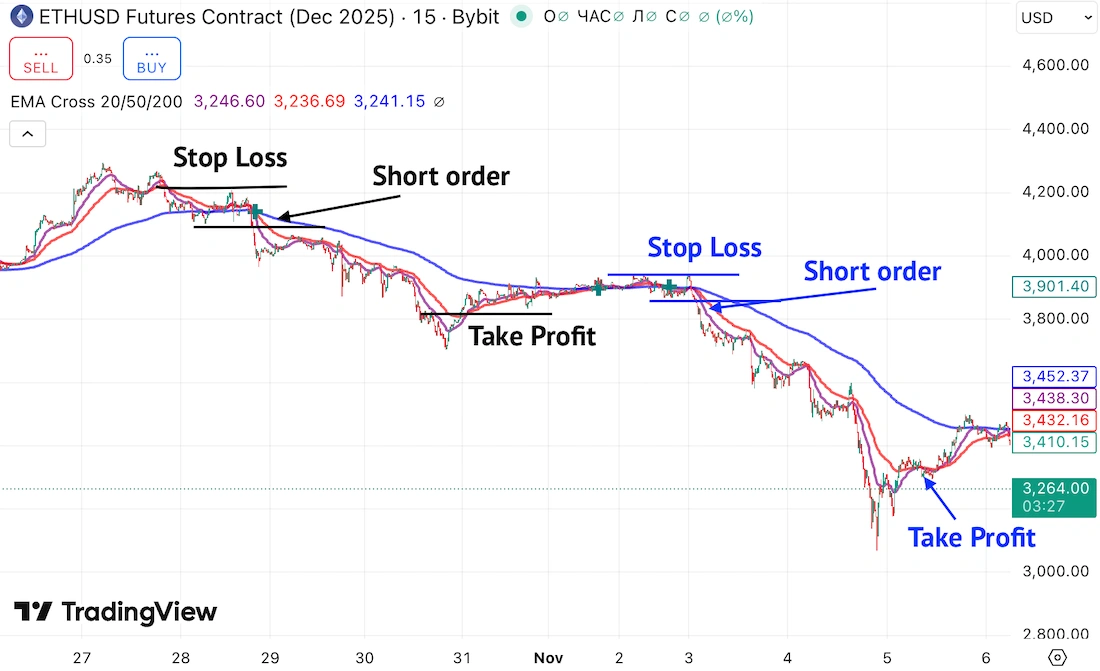
This trade offers a 1:3 risk-to-reward ratio, and the total return with leverage is 135%.
When trading EMA-based strategies, always pay attention to phases where the market is not trending. During these periods, trend indicators—including the EMA—often produce false signals. You can spot a non-trending market when the EMA moves sideways and stops rising or falling. This usually happens during low-activity conditions or periods of high volatility without a clear direction.
Advantages and Disadvantages of EMA
The table summarizes the key strengths and weaknesses of the Exponential Moving Average (EMA). Understanding these advantages and limitations helps traders apply EMA more accurately across different market conditions.
| Advantages of EMA | Disadvantages of indicator |
|---|---|
| Reacts faster to price changes due to higher weighting of recent data. | Generates many false signals during ranging/sideways markets. |
| Helps identify trend reversals earlier compared to SMA. | Highly sensitive to market noise and sudden price spikes. |
| Suitable for intraday trading and scalping. | Can be misleading in periods of high volatility. |
| Performs well in trending market conditions. | Requires additional confirmation (RSI, support/resistance, patterns). |
| Combines easily with other EMAs (crossovers, EMA ribbons). | Does not show the strength of a trend — only direction. |
| Universal tool: works on all markets and timeframes. | Still has a lag despite the accelerated calculation formula. |
EMA is a powerful and flexible tool that helps traders understand market trends, find entries, and manage risk more effectively. While it performs best in trending markets, combining EMA with additional indicators and proper risk management greatly increases accuracy. With practice and testing, EMA can become a reliable part of any trading strategy.